By Dr. Catherine Munson and Dr. Sjon Westre
Chemeon Surface Technology
1. Introduction and background
Extensive salt fog testing is required (up to 1,000 hr) to predict how well a coating will protect a basis metal in real-world applications. Electrochemical testing generally takes only a few hours and could predict how well a coating will perform in salt fog. A robust correlation between electrochemical testing and salt fog performance was found and quantified for a trivalent chromium pretreatment coating on aluminum alloy 2024-T3.
The neutral salt fog corrosion test, ASTM B117, is the current standard to determine corrosion performance of a surface coating system. However, it had many drawbacks. Although it can serve as a good process control check, there is poor correlation with actual field performance. Further, testing to failure requires up to 1,000 hours (more than one month). In the end, it is difficult to compare processes thoroughly and quantitatively.
Electrochemical analysis offers a new method to test performance. It has been found to provide good correlation with field performance on other metals,1,2 as well as correlate with salt fog results when flaws are introduced to coatings on aluminum.3 The method is fast, reducing test time from weeks to hours or days. One can easily and comprehensively compare and rank processes, different coatings and different base metals. To date however, it has been mainly tested/linked with field tests on primed/painted panels with or without scribes.
The purpose of this work is to link electrochemical analysis to neutral salt fog testing for coated but undamaged metals. This allows one to optimize new pretreatment processes more quickly and efficiently with electrochemical analysis, pursue future uses in new product development and in new pretreatment process development, and save time and money on extensive salt fog testing or developing new products/processes that do not perform well in field testing.
2. Aluminum alloy 2024-T3
The focus of this work is on aluminum alloy 2024-T3. Its composition is given in Table 1.
Table 1 – Composition of aluminum alloy 2024-T3.
The 2000 series alloys pose a number of problems in surface finishing. A high copper content is alloyed with the base aluminum, and there is a tendency to form large copper-rich sites on the surface which tend to coat unevenly. A galvanic cell is formed between copper and aluminum, promoting aluminum degradation. Compared to other aluminum alloys, high levels of corrosion are experienced. In processing, it is more difficult to coat uniformly and homogeneously. To produce the best, most corrosion-resistant conversion coatings, this alloy requires more careful surface preparation and coating formation than any other aluminum alloy.
The corrosion of aluminum on vehicles tends to be cosmetic rather than catastrophic, as steel corrosion was in the past. Early implementation of aluminum hoods on Fords led to galvanic corrosion/paint delamination due to their direct connection with steel brackets.4
More catastrophic failures, however, have been seen with aerospace applications of aluminum. A 1999 incident was related to fuselage skin panels disbonding and fatigue cracking at lap joints.5 A 2005 crash involved the loss of a wing from corrosion, causing fatigue cracks on the wing/fuselage junction brackets.6
3. Preventing corrosion on aluminum alloys
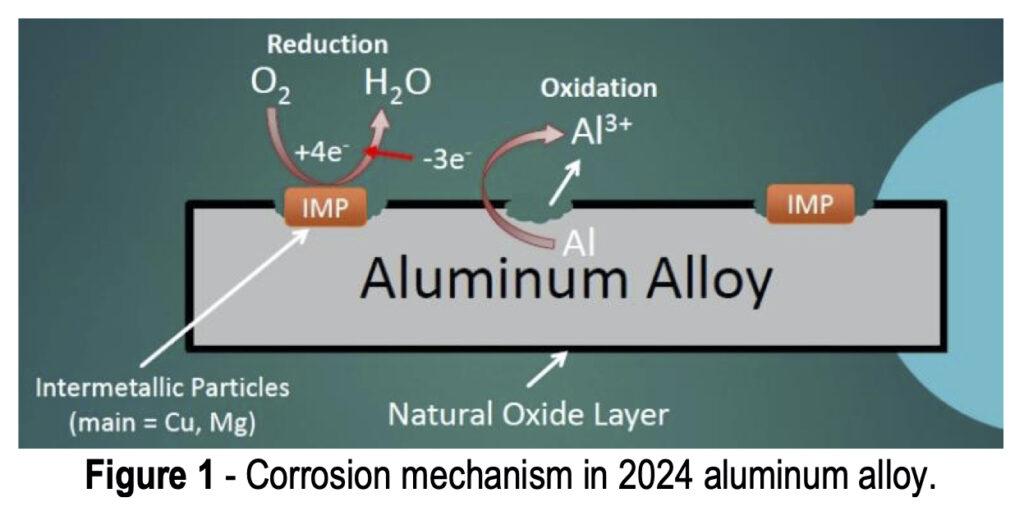
Aluminum alloys have an overall matrix composed of aluminum, which is alloyed with various other metals. One universal benefit of aluminum or its alloys is a naturally forming aluminum oxide layer, shown in Fig. 1, which occurs when the alloy is exposed to any oxygen in the environment. Some metals will be distributed throughout the aluminum matrix more evenly, such as Zn and Cr, while others will aggregate into clusters together, called intermetallic particles (IMPs).
AA 2024 particularly useful for structural components on aircraft (wing and fuselage structures), due to the high strength of the alloy coupled with good fatigue resistance. When 2024 is exposed to a corroding environment, such as saltwater or acidic clouds, the IMPs act as active sites which use electrons to assist with the oxygen reduction reaction. These electrons catalyze the aluminum oxidation by pulling free electrons away from the adjacent aluminum matrix. This leads to aluminum oxidation to free aluminum ions which leave the bulk metal causing pits.
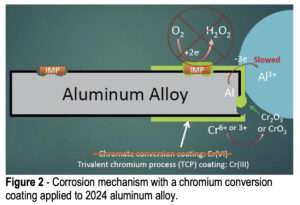 When a conversion coating is applied to the aluminum alloy surface, it completely covers both the aluminum matrix and any surface IMPs, providing barrier protection against the penetration of solution, hopefully to prevent any corrosion and any oxygen reduction at the IMP sites (Fig. 2). It should also prevent any aluminum oxidation, but the coatings do tend to have small pinholes and occasional cracks, so at the very least aluminum oxidation will be slowed. At any open sites where the aluminum is exposed, the hexavalent chromium in the coating will react with any oxygen present to form trivalent chromium oxides at the damaged sites to prevent further matrix loss. Trivalent conversion coatings do not exhibit this “self-healing” behavior like hexavalent conversion coatings. However, hexavalent conversion coatings are being phased out due to their health and environmental hazards.
All of this is relatively well known, especially for the chromium conversion coatings using hexavalent (Cr(VI)) chemistry. However, the well-known European Union (EU) Directives regarding Cr(VI) processes, including the Registration, Evaluation, Authorization and restriction of Chemicals (REACh), End of Life Vehicle (ELV), Restriction of Hazardous Substances (RoHS) and Waste Electrical & Electronic Equipment (WEEE) regulations have all but banned hexavalent chemistries from the European Union and, in effect, globally, as other nations and jurisdictions follow the lead of the EU.
A viable alternative involves trivalent Cr(III) conversion coating processes. The question therefore becomes, do the Cr(III) coatings provide the same full barrier coverage despite the lack of active corrosion prevention?
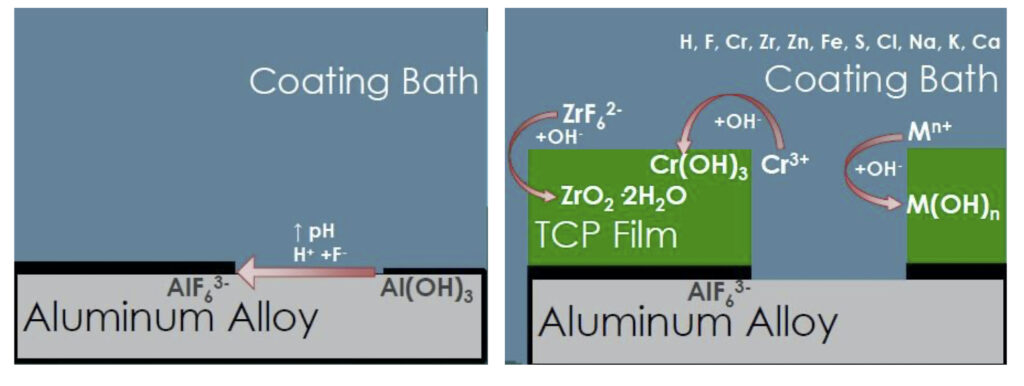
As shown in Fig. 3(a), when the AA is exposed to the acidic coating bath, any residual oxide layer and some of the matrix itself is etched away with the fluoride and hydrogen ions, forming an aluminum hexafluoride interfacial layer, water, and hydrogen gas. The resulting decrease in hydrogen ions causes an increased pH at the metal surface, catalyzing the next steps of the coating formation process.
Figure 3 – TCP film composition and corrosion protection.
After the initial aluminum hexafluoride interfacial layer forms, the TCP coating itself begins to form (Fig. 3(b)), catalyzed by the increased surface pH. The free hydroxide ions present at the surface react with chromium present in the coating bath to form Cr(III) oxides, zirconium and fluoride complexes to form zirconium oxides, and some zinc to form zinc oxides. All of these oxides form a conformal coating which is hopefully free of hole and cracks to prevent any penetration to the aluminum surface below. These reactions can also be monitored using OCP measurement during the coating formation.
4. Salt fog and electrochemical measurement
4.1 Salt fog testing
Salt fog testing protocol is generally followed according to the following commercial and military specifications: ASTM B-117, MIL-DTL-5541 and MIL-DTL-81706. In general, the salt fog arises from a 5 ± 1 wt% solution of NaCl at pH 6.85 ± 0.35. A temperature of 35 ± 2°C is maintained inside the chamber, dispersing fog at 1.5 ± 0.5 mL/hr. Chamber performance is checked daily (minus weekends/holidays) with chamber open for < 1 hr. Test panels are set up in chamber tilted at 6° from vertical, with no salt spray directly impinging on the panels. Testing to failure (i.e., one panel with >5 pits or >15 pits over five panels exposed), the exposure time in the salt fog and the number of pits is recorded.
4.2 Electrochemical analysis
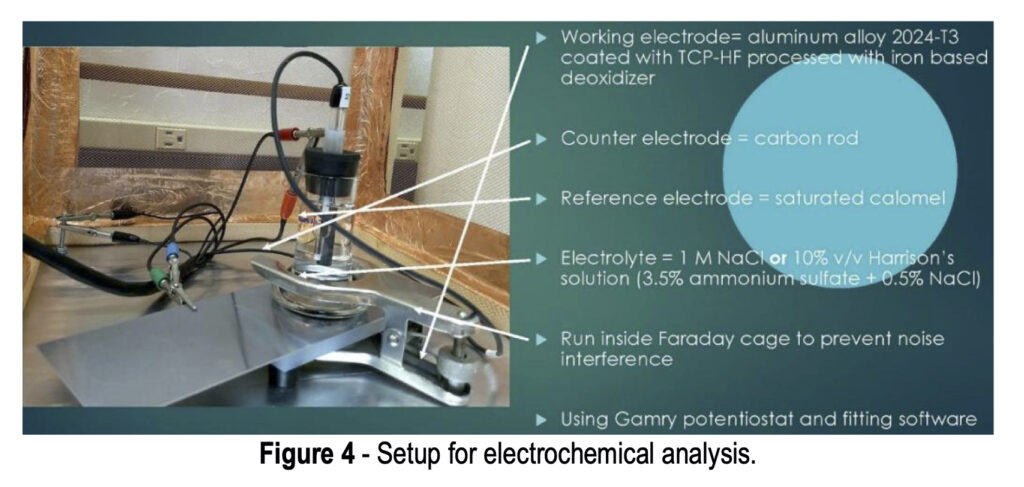
The setup for electrochemical analysis is shown in Fig. 4. Three electrodes are used in this test. The working electrode is the actual test sample, in this case a 2024-T3 aluminum alloy coated with a TCP-HF conversion coating. A saturated calomel electrode (SCE) is used as a reference, while a carbon rod is used as a counter electrode. The electrolyte in the cell is either a 1.0M NaCl solution or a 10 vol% Harrison’s solution (3.5 wt% ammonium sulfate plus 0.5 wt% NaCl in water). The test is run inside a Faraday cage to prevent electrical noise interference. Measurements use a Gamry*** potentiostat and curve fitting software.
There are three electrochemical methods employed in this work, each providing a unique measurement to be used for corrosion evaluation. They are:
• Open circuit potential (OCP) measurements
• Electrochemical impedance spectroscopy (EIS)
• Tafel measurements
Figure 5 – Aqueous electrolyte-electrode interface: the Gouy-Chapman-Stern
model for a NaCl solution.
4.2.1. Open circuit potential
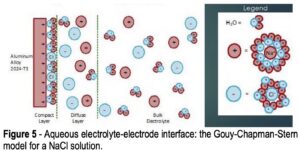 Referring to Fig. 4, the voltage is measured between the reference electrode and the working electrode (coated aluminum panel) due to formation of a double layer at the working electrode surface, as per the Gouy-Chapman-Stern model, which describes the ionic environment in the region around a charged surface (Fig. 5).7 The potential arises through the rearrangement of water molecules and salt ions at the coated metal surface, because of the naturally occurring charge. The measurement is performed over an extended period of time to allow the system to reach equilibrium. A less negative potential indicates better corrosion resistance and a lower initial charge on the coated metal surface. Any associated current flow between the counter and working electrodes is due to electron and ion movement and is not recorded.
4.2.2. Electrochemical Impedance Spectroscopy
Electrochemical impedance spectroscopy is particularly sensitive to surface changes at a level that is not detectable by other methods. Such changes include penetration of corrosion protective layers, including conversion coatings. The method goes beyond simple electrical resistance and measures the more complex property of impedance found in electrolytic processes. Here, resistance, capacitance and, to a lesser extent, inductance are studied.
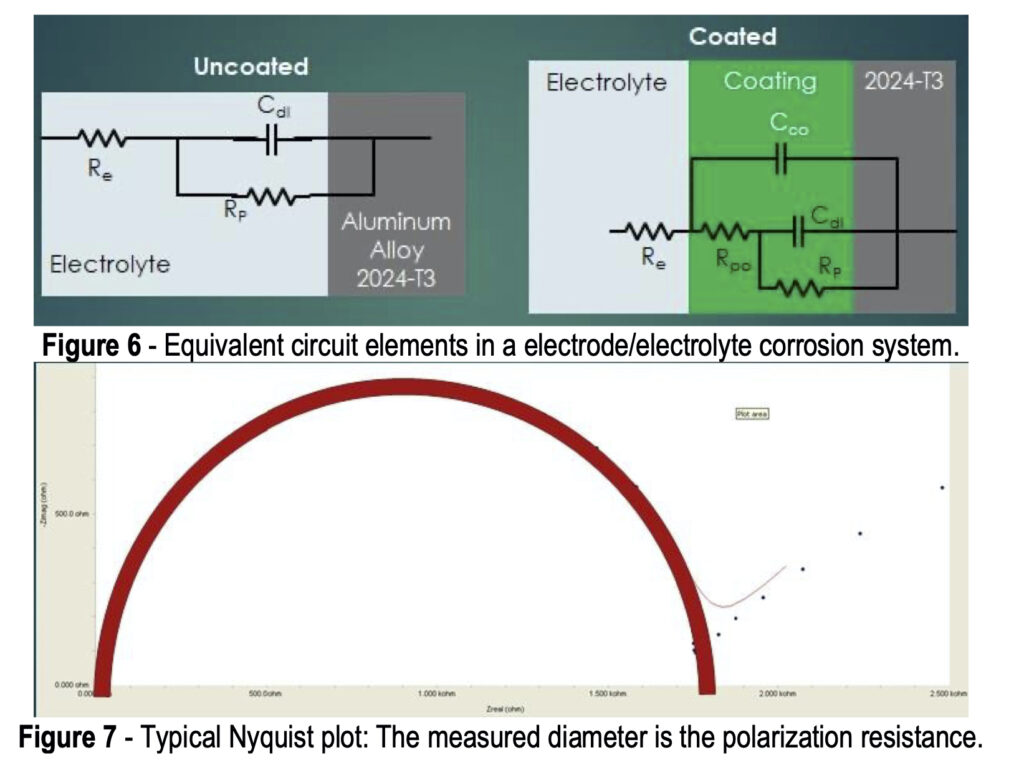
Referring again to Fig. 4, the potentiostat applies a set potential between reference and working electrode, and current flows as a result of the applied charge on the coated metal working electrode. This set potential is fluctuated a small amount (~1 mV) in a sinusoidal pattern around the set potential while changing the frequency. The current is measured between the counter and working electrodes. The current data is fit to a representative circuit descriptive of the electrode/electrolyte interface, as shown in Fig. 6.
In the uncoated aluminum alloy illustrated in Fig. 6, there is the circuit element RE, representing the electrolyte resistance, or resistance to electron flow through the salt solution. At the electrolyte/electrode interface (See Fig. 5), two equivalent circuit elements are in parallel: (1) CDL, the double layer capacitance, i.e., the charge held in the double layer interface, and (2) RP, the polarization resistance, i.e., the resistance to electron flow through the double layer.
The addition of the conversion coating presents a more complex equivalent circuit. As noted earlier, although a newly-applied conversion coating may be impervious to corrosion attack, it is not perfect and eventually pores do develop, and salt solution can penetrate through to the metal surface. The equivalent circuit is then further characterized by CCO, the coating capacitance, i.e., the charge held in the coating, and RPO, the pore resistance, i.e., the resistance to electron flow through the coating pores in series.
More comprehensive information on the principles of EIS is available elsewhere,8-11 but for the purpose of this paper, the known elements, such as the solution resistance, and the current / frequency response impedance data (in Ohms) are used to fit a Nyquist plot to determine values of the pore resistance and double layer capacitance.11 Nyquist plots involve complex numbers, with real and imaginary components. In the typical logarithmic plot shown in Fig. 7, the y-axis values represent capacitance. The measured diameter corresponds to the polarization resistance, which indicates the corrosion resistance. The higher the polarization resistance, (i.e., the larger the Nyquist plot diameter) the less corrosion occurring. The corrosion resistance of test samples can thus be evaluated and ranked.
4.2.3. Tafel measurements
Figure 8 – Fitting Tafel data with the Butler-Volmer equation:
Raw data
In Tafel measurements, or Linear Sweep Voltammetry (LSV), the applied potential is slowly ramped, going from a point more negative than the open circuit potential to a point more positive than the OCP to induce corrosion. At more negative potentials, oxygen reduction occurs; at more positive potentials, aluminum oxidation occurs.
Here, the potentiostat applies a set potential between reference and working electrode, and current flows as a result of the changing charge on the coated metal working electrode (measured between the counter and working electrodes). Differences in the current flow indicate the performance of the coated metal working electrode, and a lower measured current means less corrosion. The current/potential Tafel plots can be ranked and compared.
Figure 9 – Fitting Tafel data with the Butler-Volmer
equation: Tafel slopes, corrosion potential & current.
The Tafel plot in Fig. 8 shows the applied potential on the Y axis and the resultant current on the x-axis. The raw data is shown in blue. As the potential is increased, the current reaches a minimum at the open circuit potential. The lower this minimum, the better the corrosion performance. A further voltage increase leads to pitting in the coating (i.e., at the pitting potential). Beyond this point, the corrosion damage penetrates to the aluminum surface. Better corrosion resistance is indicated with a less negative potential at which the “plateau” occurs in this region. Curve fitting is used to establish the two linear red lines, the anodic (upper) and cathodic (lower) Tafel slopes, which represent coating performance minus the redox reaction factors.
The simplified plot in Fig. 9 shows relationship of the data to the Butler-Volmer equation, which determines the Tafel slopes which intersect to yield the corrosion potential, Ecorr and current, icorr:12
5. Experimental plan
Our experimental plan is based on the idea that more aggressive pretreatments cause poor coating formation and performance. Thus, we sought a full comparison of the best and worst practices with an aggressive pretreatment condition. Here, and iron-based deoxidizer offers a more aggressive pretreatment than typically recommended. Accordingly, the results for the best process would be indicated by the longest salt fog time to failure with the least pits. The worst process would produce the shortest salt fog time to failure with the most pits. Once these results were established, the goal was to link the best and worst performing processes (via salt fog testing) to their electrochemical behavior, which would be expected to show the same trends and rankings.
5.1 Test panel preparation
Four processes, here referred to as T1, T2, T3 and T4, were evaluated in salt spray, and via the three electrochemical tests outlined above. Five panels of each process type were subjected to salt fog.
The aluminum panels were prepared according to the following protocol:
1. Alkaline cleaner
2. Double water rinse
3. Iron-based deoxidizer
4. Double water rinse
5. Trivalent chromium conversion coating
6. Short DI water rinse
A 24-hour cure time (ambient temperature away from coating line) occurred before salt fog or electrochemical testing
Table 2 – Salt fog results
Process Hours
to Failure Pits @ 336 hr
Pass/Fail? Pits/panel
(Total Pits)
T1 336 7, Failed 5+,1,1,0,0 (7)
T2 840 0, Passed 5+,5+,0,0,0 (16)
T3 336 25+, Failed 5+,5+,5+,5+,5+ (25+)
T4 336 5+, Failed 5+,0,0,0,0 (10+)
6. Salt fog and electrochemical results
6.1 Salt fog test results
The results for salt fog testing are shown in Table 2. Process T2 is seen to have performed the best, with the longest salt spray time before failure. Process T3 performed the worst, with the shortest salt spray time and the largest number of pits within that time. Processes T1 and T4 showed the same short salt spray time at 336 hr with fewer pits. The ranking of the process performance in salt spray is T2 > T1 = T4 > T3. This ranking serves as the benchmark for comparison with the three electrochemical analytical tests.
6.2 Open circuit potential (OCP)
The results for OCP measurements in 1.0M NaCl solution are shown in Fig. 10. Less negative values correspond to greater corrosion resistance. The results in Fig. 10(a) reflect the average for three test samples. These measurements are in accord with the salt spray rankings (T2 > T1 = T4 > T3). When the 90% confidence interval is taken into account, there is no statistically significant difference between processes T3 and T4. However, it should be noted that T3 and T4 exhibited the worst salt spray results of the four processes.
(a) (b)
Figure 10 – OCP measurements in 1.0M NaCl: (a) average open circuit potential (n=3) versus time to 30 min; (b) OCP process comparisons showing 90% confidence intervals.
Figure 11 – OCP measurements in Harrison’s solution.
OCP measurements need not be limited to 1.0M NaCl solution. Figure 11 shows OCP measurements of another set of samples immersed in 10% by volume Harrison’s solution, which is an aqueous solution of 3.5% (NH4)2SO4 and 0.5% NaCl. After equilibrium is reached, the rankings are identical to the results in 1.0M NaCl.
6.3 Electrochemical impedance spectroscopy (EIS)
The results for EIS measurements in 1.0M NaCl solution are shown in Fig. 12. The results in Fig. 12(a) reflect the average for three test samples. The larger diameter of the Nyquist plot circle, the greater the resistance polarization, and thus the corrosion resistance. As with the OCP results, these measurements are in accord with the salt spray rankings (T2 > T1 = T4 > T3). Figure 12(b) compares the coating capacitance values, with 85% confidence intervals shown for the three samples in each process. The actual mean for each result is again in accord with the salt spray rankings.
(a) (b)
Figure 12 – Nyquist plots and equivalent circuit fitting in 1.0M NaCl: (a) Nyquist impedance plots for the four processes (n=3); (b) coating capacitance comparisons showing 85% confidence intervals.
Figure 13 – EIS measurements in Harrison’s solution.
As with the OCP study, measurements using Harrison’s solution as an electrolyte were conducted. As shown in Fig. 13, the Nyquist diameters again rank the measured resistance polarization in the benchmark order determined by salt fog testing, with greater spread between samples.
6.4 Tafel measurements
The results for Tafel measurements in 1.0M NaCl solution are shown in Fig. 14. The results in Fig. 14(a) reflect the average for three test samples. The lower the current flow at open circuit potential, the higher the corrosion resistance. As with the other electrochemical measurements, the results of the corrosion “plateau” portion of the curves are in accord with the salt spray rankings (T2 > T1 > T4 > T3). The open circuit current clearly shows the T1 process to be superior. Figure 14(b) compares the Ecorr values, with 95% confidence intervals shown for the three samples in each process. The results confirm the two worst processes, T3 and T4.
(a) (b)
Figure 14 – Tafel Plots with Butler-Volmer Fitting in 1 M NaCl: (a) average Tafel curves for the four processes (n=3); (b) corrosion potential comparisons showing 95% confidence intervals.
7. Summary
The salt fog and electrochemical results in 1.0M NaCl are summarized and compared in Table 3.
Table 3 – Salt fog results compared to electrochemical measurements in 1.0M NaCl.
Process Salt Spray
Time (#pits) OCP
(V) RP
(kΩ)† Coating C
(Farads)† iCORR
(μA)† ECORR
(V)†
T1 336 hr (7) -0.721 (11) 15 (5) 2.9 (8) E-5 3 (1) -0.652 (11)
T2 336 hr (0)* -0.644 (11) 28 (5) 1.9 (8) E-5 0.97 (10) -0.671 (16)
T3 336 hr (20+) -0.771 (25) 9 (1) 5.0 (1) E-5 2.2 (5) -0.753 (24)
T4 336 hr (5+)** -0.765 (16) 14 (4) 3.0 (1) E-5 0.9 (3) -0.720 (23)
*Ultimate failure at 840 hr (16 pits)
**5+ pits on one panel only; the other four showed 0 pits.
†Data reflects the mean and standard error in parentheses.
All electrochemical measurements lined up well with the benchmark salt spray performance. The open circuit potential (OCP) measured most positive for the best process and most negative for the worst. For the electrochemical impedance spectroscopy (EIS), polarization resistance was highest for the best process and lowest for the worst, while coating capacitance was lowest for the best process and highest for the worst. In the Tafel study, corrosion current was lowest for the best process and high for the worst, while the corrosion potential was most positive for the best process and most negative for the worst. The electrochemical measurements (specifically the polarization resistance and open circuit potential) could better differentiate between processes than the salt spray performance.
8. Conclusions
In the benchmark salt fog testing, the four ranked processes for time in salt spray and pit numbers were
T2 > T1 = T4 > T3. For electrochemical testing the ranking was the same for the various electrochemical parameters measured (T2 > T1 > T4 > T3). Processes T1 and T4 were easily separated and ranked using the electrochemical analysis. This excellent correlation shows that electrochemistry can be used as a predictor of salt fog performance.
9. Future electrochemical testing
Future work is planned to determine the best conversion coating processes on different types of aluminum alloys (5052, 6061, 7075) and different light metals (Mg, Zn/Ni). This work will enable more rapid procedures for product reliability control for new products. More comprehensive study can link the exact time in salt spray to electrochemical performance for global cutoffs on coating performance. Finally, different pretreatments can be compared to determine the best performing full process rather than just optimizing one step of the pretreatment. The key is that time is saved to allow more comprehensive testing.
